Section 2 · Lesson 2
Explore the data
Find the patterns and quality problems in the listings before you build any model.
- Which features carry the most signal about price, and which carry little.
- Why missing values here often mean something, and how to tell.
- How to separate real outliers from data errors.
- How geography shows up in the tiers.
Start with questions, not plots
The first two milestones of the project were exploratory data analysis (EDA) and preprocessing. Each EDA question ended in a decision: drop, fix, transform, or keep. The same habit helps you in any project. Before you plot, write down what the answer changes.
The following sections follow the project's findings in that order. Every number comes from the milestone reports and milestone2/ANSWERS.md, except where the text says a course script recomputed it.
Which features carry signal
Milestone 1 ranked features by adjusted mutual information (AMI) on a 30,000-row sample, which measures how much a feature tells you about the tier without assuming a straight-line relationship. zones, max_seats, metro, and access_type ranked highest. The review scores were tightly clustered across tiers, so they help little on their own.
The following figure shows four relationships. Bigger spaces cost more, and so do listings with more facilities. The tier mix also shifts steadily with review_count, and a missing zones value points toward tier 1.
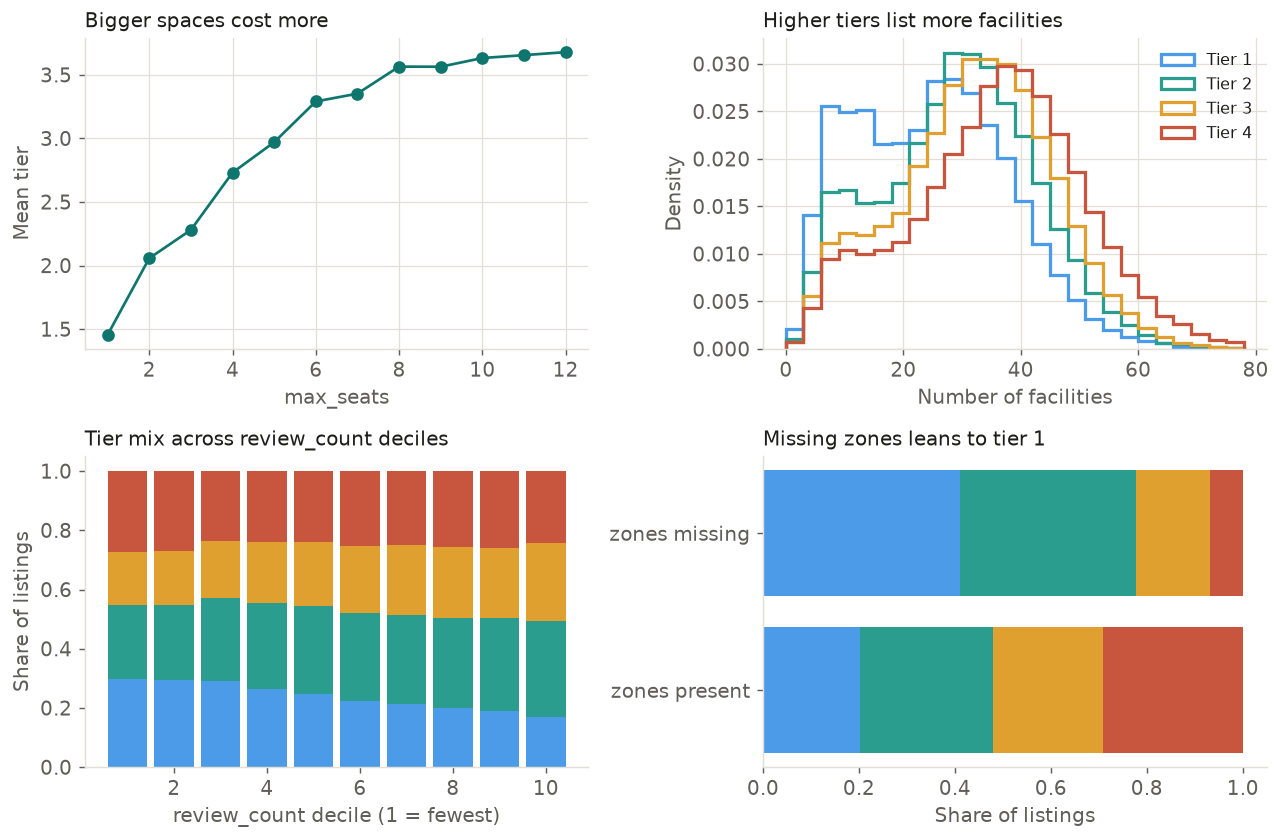
train.csv. The mean number of facilities rises from 24.5 in tier 1 to 35.4 in tier 4.Tier 1 makes up 29.7% of the lowest review_count decile and 17.0% of the highest. What does this tell you?
- Review count is informative about the tier, even though it's only a weak, monotonic trend.
- Review count causes a listing to move to a lower tier.
- Review count is useless, because tier 1 is still the smallest share.
The share changes steadily across the deciles, so the feature carries signal. The data can't show causation, and a modest trend can still help a model that combines many features.
Missing values often mean something
About 859,000 cells are missing in the training data. Before you fill any of them, ask why each one is missing. The following figure shows the columns that have gaps.
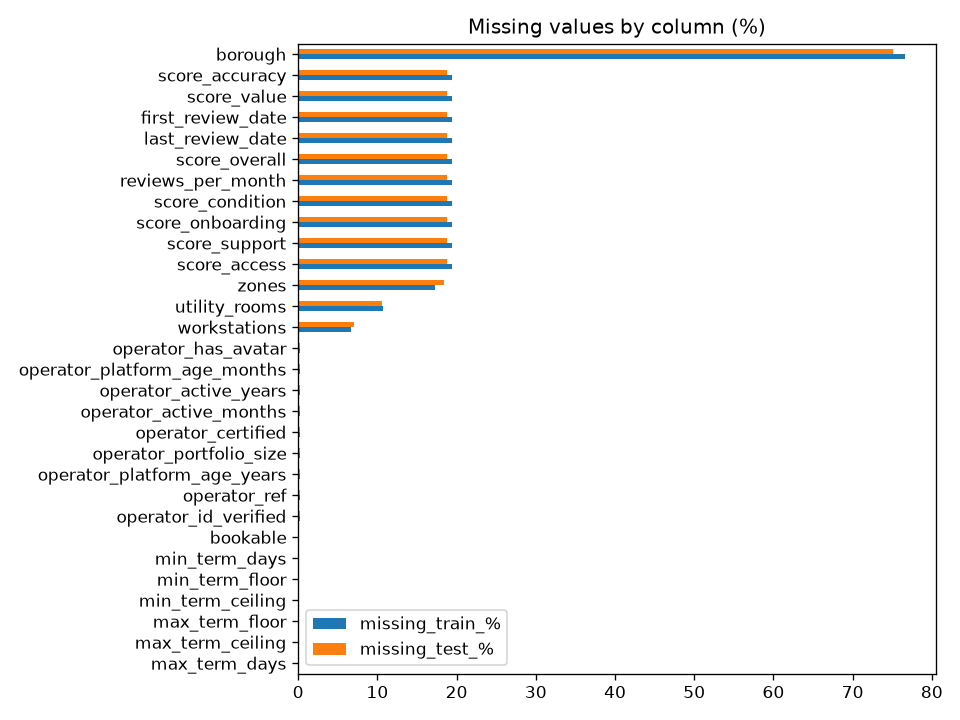
The reasons differ by column:
borough(76.7%) is structural. It's missing for every listing in 11 of the 16 metros and present for every listing in the other 5. Those 11 metros have no boroughs.- Review scores and dates (19.4%) are missing when a listing has no reviews.
zones(17.3%) carries signal. The mean tier is 1.88 when it's missing and 2.61 when it's present. The share of tier 1 is 41% against 20% (a course script recomputed this).- Operator fields (0.2%, 604 rows) go missing together.
Outliers: real or errors?
review_count has a skew of 5.4 and a maximum of 4,222 against a 99th percentile of 406. operator_portfolio_size has a skew of 16.1 and a maximum of 5,978. By the 1.5 × IQR rule, 10-14% of rows count as outliers in these columns. These listings are real: large operators and popular listings exist. Deleting them would bias the model, so the project transforms them instead (Lesson 3).
A different kind of extreme value is a data error. 62 rows have max_term_days values up to 577 million days, more than 1.5 million years. The 99.9th percentile is exactly 1,125 days, which suggests that 1,125 is the platform's cap and the larger values are placeholders.
Duplicates and redundancy
- 1,116 training rows match another row on every column except
space_id, including the label. - 43 groups of rows have identical features but different tiers. These conflicts are irreducible noise: no model can get them all right.
- Several columns repeat one another. Spearman correlation between
min_term_daysandmin_term_flooris 1.00, andopen_slots_bandopen_slots_ccorrelate at about 0.97. Tree models handle redundancy well, so the project keeps these columns.
Facilities
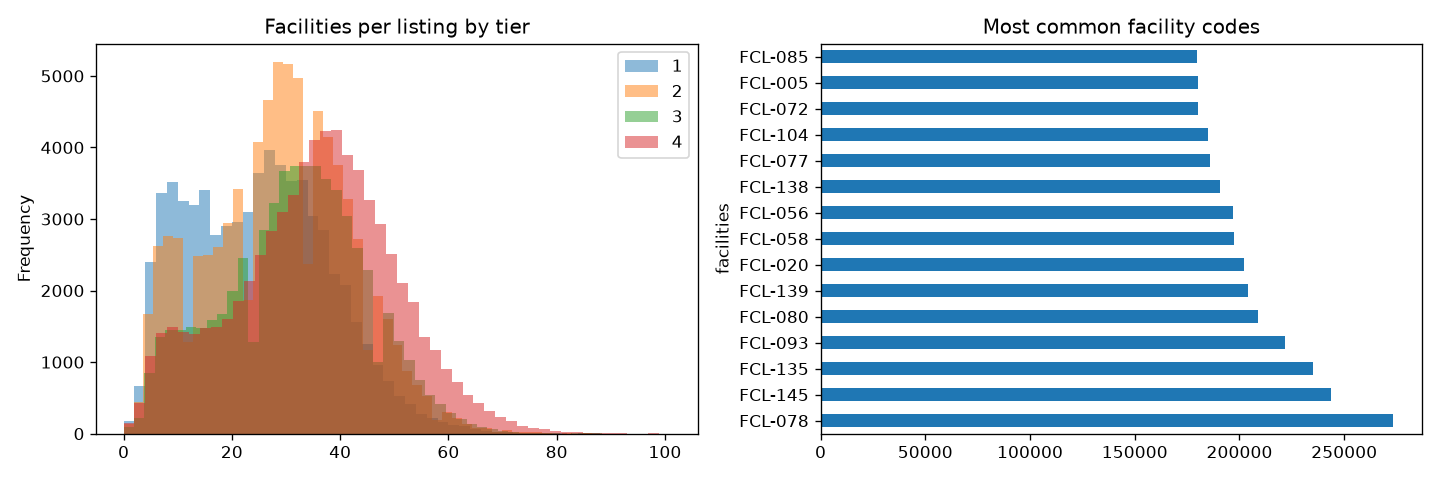
The facilities column is a JSON list of codes such as "FCL-087", with a median of 30 per listing. Both the number of facilities and the specific codes carry signal. Lesson 4 turns them into one binary column per code, which gave the largest gain of any non-target feature.
Geography
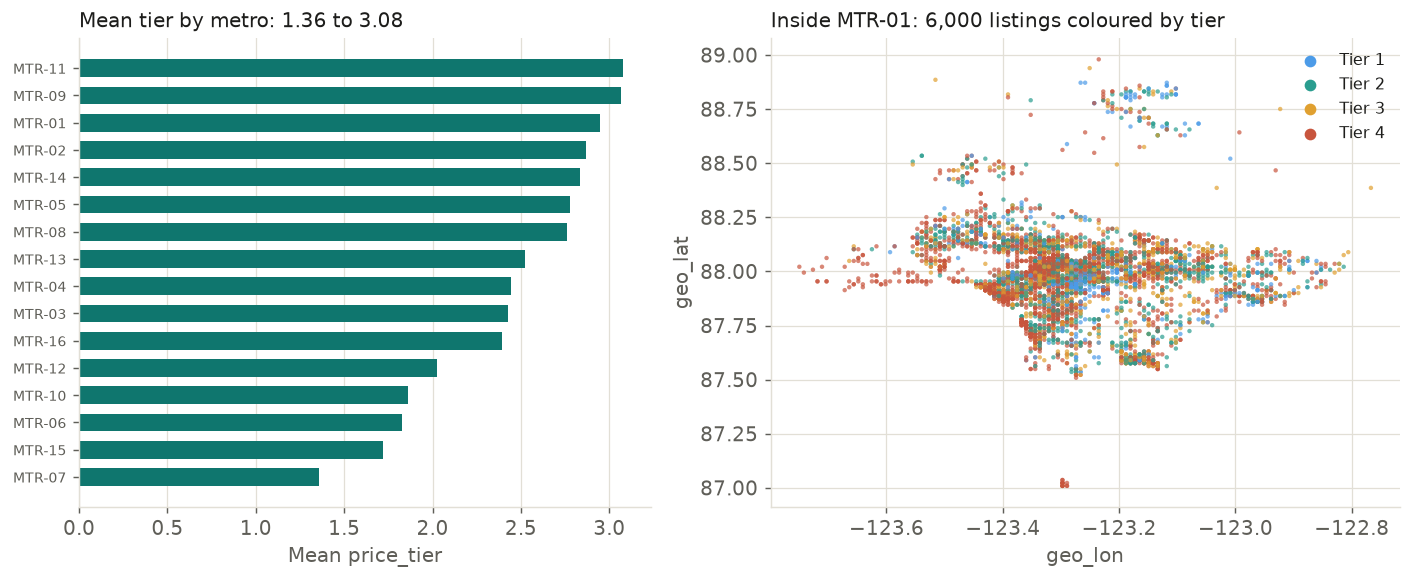
The coordinates aren't spread evenly across the globe. The 279,746 listings fall into 16 metro areas, and each metro covers a tiny range of latitude and longitude. The average tier differs a lot between metros, from 1.36 in MTR-07 to 3.08 in MTR-11. Within a metro, tiers mix, but some neighborhoods lean one way. A course script generated the following figure.
Filter the listings by metro, tier, and seats
Pick a metro, turn tiers on and off, and raise the minimum seat count. The sample has up to 600 listings per metro. Watch how the tier mix changes in different corners of the metro.
Borough is missing for every listing in 11 of the 16 metros. What is the best way to treat it?
- Fill it with the most common borough.
- Drop the 77% of rows that lack it.
- Give it its own
nonelevel, because those metros have no boroughs.
The value is structurally missing, not randomly missing. A separate level keeps the information that the metro has no boroughs, and no rows are lost.