Section 2 · Lesson 1
Understand the problem and the data
Learn what the price-tier task asks, why macro F1 is the metric, and what the listing data contains.
- What the price-tier task asks you to predict, and what the final deliverable looks like.
- How macro F1 differs from accuracy, and why it suits four balanced tiers.
- What each group of columns in
train.csvdescribes. - Why 34% of test listings are harder than they look.
The task
Each row of train.csv is a listing for a bookable workspace: a desk, a private room, or a whole unit that an operator rents out. Each listing has a price_tier from 1 (cheapest) to 4 (most expensive). Your job is to predict that tier for every listing in test.csv, which has no labels.
This is a multiclass classification problem with ordered classes. Predicting tier 4 for a tier 3 listing is a smaller mistake than predicting tier 1, a fact that Lesson 5 uses for one of the models.
The columns
The 58 features fall into a few families. The following table summarizes them.
| Family | Example columns | What to know |
|---|---|---|
| Operator | operator_ref, operator_class, operator_portfolio_size, operator_certified | operator_ref has 41,903 distinct values. The t and f flags need converting to 1 and 0. |
| Location | metro, zone, borough, geo_lat, geo_lon | zone has 1,380 values. borough is missing for 76.7% of rows. |
| The space | space_class, access_type, max_seats, utility_rooms, workstations, facilities | space_class has 131 levels. facilities is a JSON list of codes such as "FCL-087". |
| Booking terms | min_term_days, max_term_days, and their floor, ceiling, and average variants | A few max_term_* values are placeholders that reach 577 million days. |
| Availability | open_slots_a to open_slots_e, booked_load, bookable, snapshot dates | Counts of open slots over growing windows. |
| Reviews | review_count, reviews_per_month, score_*, first and last review dates | Missing for listings with no reviews (19.4% of rows). |
The submission
You submit a CSV with two columns, ID (the listing's space_id) and price_tier (an integer from 1 to 4). The competition allows NumPy, pandas, scikit-learn, LightGBM, XGBoost, CatBoost, SciPy, and a few plotting and statistics libraries. The final notebook uses only NumPy, pandas, scikit-learn, LightGBM, and Matplotlib.
The metric: macro F1
The metric is macro F1. For each tier \(k\), compute the F1 score from that tier's precision and recall. Then average the four values with equal weight:
$$\text{macro F1} = \frac{1}{4}\sum_{k=1}^{4} \frac{2\,P_k R_k}{P_k + R_k}$$Because every tier counts equally, a model can't hide a weak tier behind a strong one. The classes are close to balanced, so accuracy and macro F1 are similar here, but they diverge when a model neglects one tier. The following figure shows the class counts.
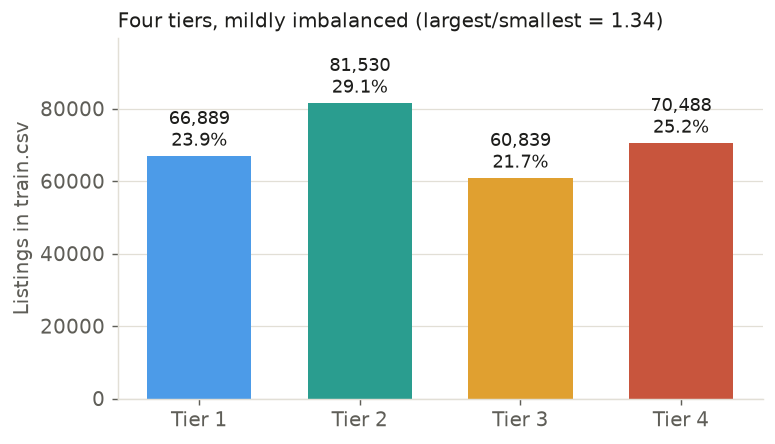
train.csv. The largest tier is 1.34 times the smallest.Macro F1 and accuracy calculator
Edit any cell of the confusion matrix. Rows are the true tier, columns are the predicted tier. The matrix starts with the real fold-0 holdout predictions of the project's three-model blend (55,950 listings). Then try a preset.
A model predicts tier 2 for every listing. Why does macro F1 punish it more than accuracy does?
- Macro F1 ignores the largest class.
- Tiers 1, 3, and 4 get an F1 of 0, and macro F1 weights each tier equally.
- Macro F1 depends on the order of the tiers.
Accuracy is 29.1% because tier 2 is the largest class, but three of the four per-class F1 scores are 0, so macro F1 is about 0.11. Try the "Always predict tier 2" preset.
Seen and unseen operators
Many listings share an operator, so the operator carries information about price. But 33.6% of test listings belong to an operator that never appears in train.csv. Any feature that memorizes operators gives no help for those rows. Keep this in mind in Lessons 3 and 4: it is the reason the project avoids using operator_ref as a raw category.
Source. The sizes and missing-value shares come from milestone2/ANSWERS.md. The unseen-operator share is 33.6% in that file and 34% in NOTEBOOK_GUIDE.md, and the course scripts reproduce 33.56%.
Where the project goes
- Explore the data and find its quality problems (Lesson 2).
- Clean it with a leak-free pipeline (Lesson 3).
- Engineer features, including out-of-fold target encodings (Lesson 4).
- Compare LightGBM, ordinal, CatBoost, and XGBoost models (Lesson 5).
- Validate with stratified folds and tune class weights (Lesson 6).
- Blend the models and write
submission.csv(Lesson 7).
Which statement about price_tier is true?
- It's a continuous price in dollars.
- It has two unordered classes.
- It has four ordered classes from 1 to 4.
The label is an integer from 1 to 4 with no missing values, and the tiers have a natural order.